What you need
Use grayscale images with manually checked foreground masks. Keep a separate evaluation set from the images used to tune the threshold.
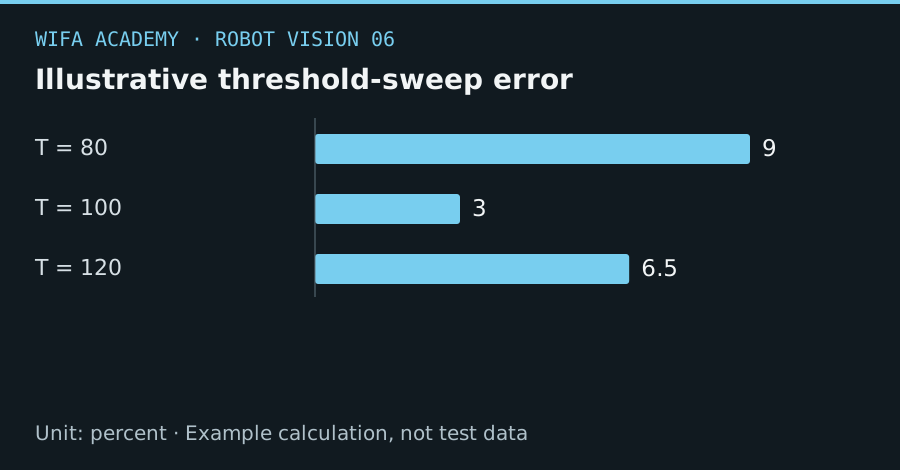
Read the diagram as a data table
| Condition or component | percent |
|---|---|
| T = 80 | 9 |
| T = 100 | 3 |
| T = 120 | 6.5 |
The calculation
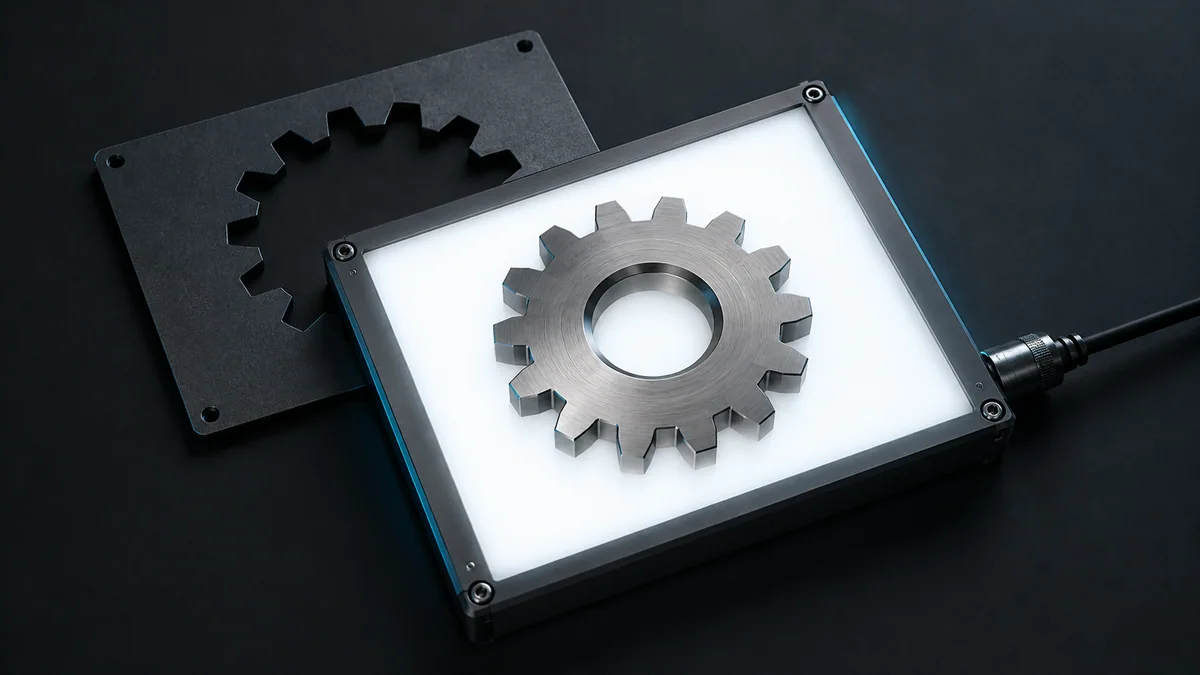
M(u,v) = 1 if I(u,v) > T, otherwise 0
error_rate = incorrect_pixels / labeled_pixels
I is grayscale intensity, T is the threshold and M is the binary mask. Pixel error does not directly equal object-detection error.
Worked example
For 10,000 labeled pixels, thresholds 80, 100 and 120 might produce illustrative errors of 900, 300 and 650 pixels: 9%, 3% and 6.5%. The middle threshold wins this test, but still needs validation on new lighting conditions.
Try it step by step
- Define whether the part is brighter or darker than the background and invert the mask consistently if required.
- Sweep a small range of thresholds on the tuning images and compare foreground loss with background leakage.
- Test the chosen threshold on untouched images and inspect difficult edges, holes and touching parts.
- If illumination varies spatially, compare controlled lighting or adaptive thresholding rather than endlessly retuning one global value.
How to check the result
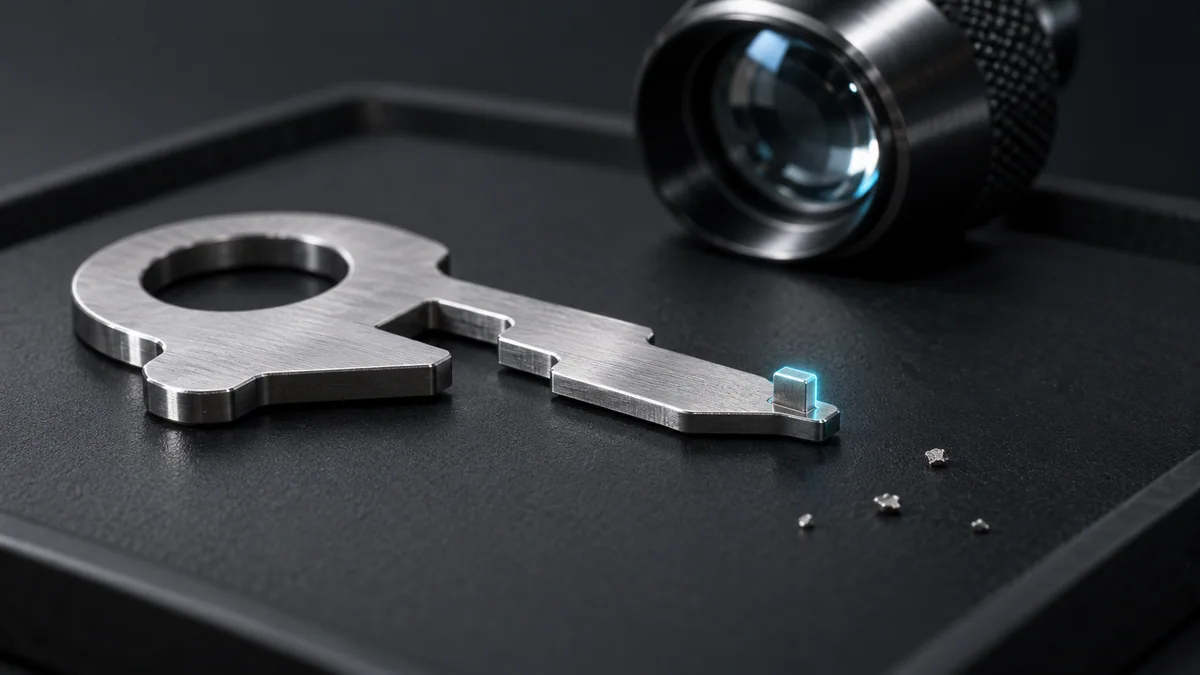
Check complete-object detection and centroid accuracy in addition to pixel error. A small missing neck can split one part into two components.
Common mistake to avoid
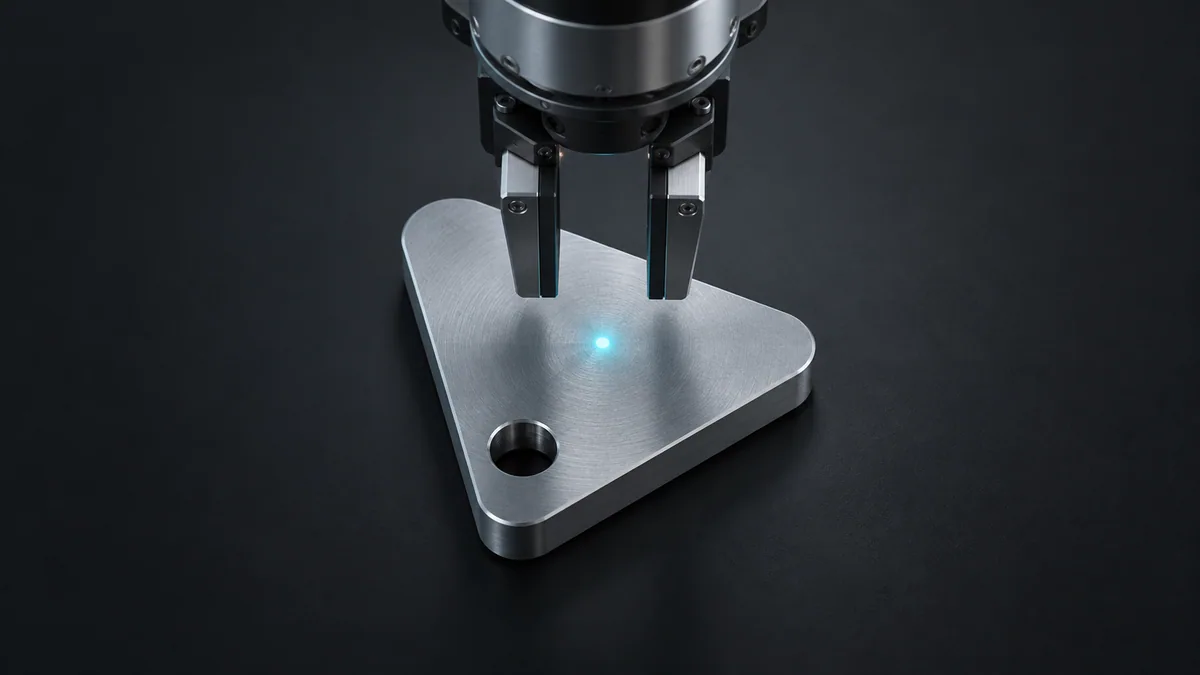
The lowest pixel error may still be wrong for gripping. A large background region can dominate the metric and hide missed small parts.
Reference reading
Primary references for the underlying models, APIs or application context. The worked numbers and plots above are educational calculations, not results reported by these sources.