What you need
Use replayed images and a motion simulator with the real workspace bounds. Keep an independent set of physical validation targets.
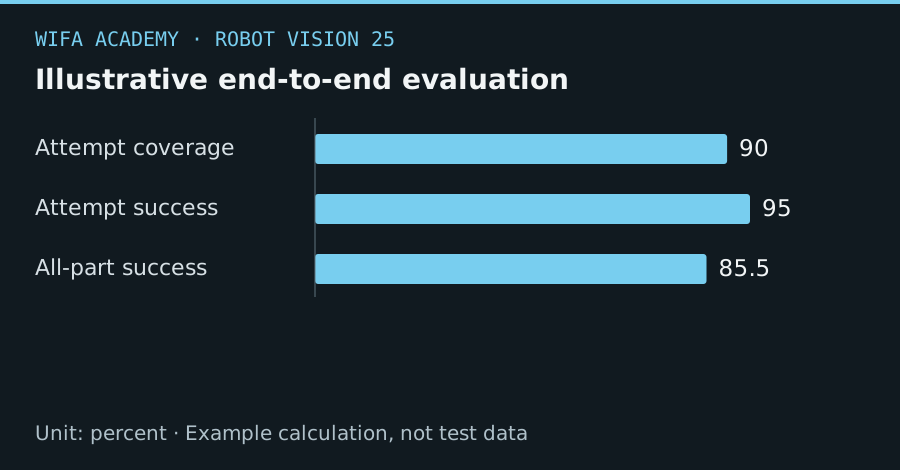
Read the diagram as a data table
| Condition or component | percent |
|---|---|
| Attempt coverage | 90 |
| Attempt success | 95 |
| All-part success | 85.5 |
The calculation
pick_success_rate = successful_picks / attempted_picks
coverage = attempted_valid_parts / all_valid_parts
Define successful placement and valid parts before testing. Success rate and coverage answer different questions.
Worked example
If 180 of 200 valid parts are attempted and 171 attempts succeed, pick success is 95% but coverage is 90%. End-to-end successful processing is 171/200 = 85.5%. Reporting only 95% hides the rejected opportunities.
Try it step by step
- Create test cases for empty scenes, multiple parts, out-of-bounds targets, stale frames, occlusion and invalid calibration.
- Require correct units, frame identity, target age and confidence or geometric checks before the simulator accepts a pose.
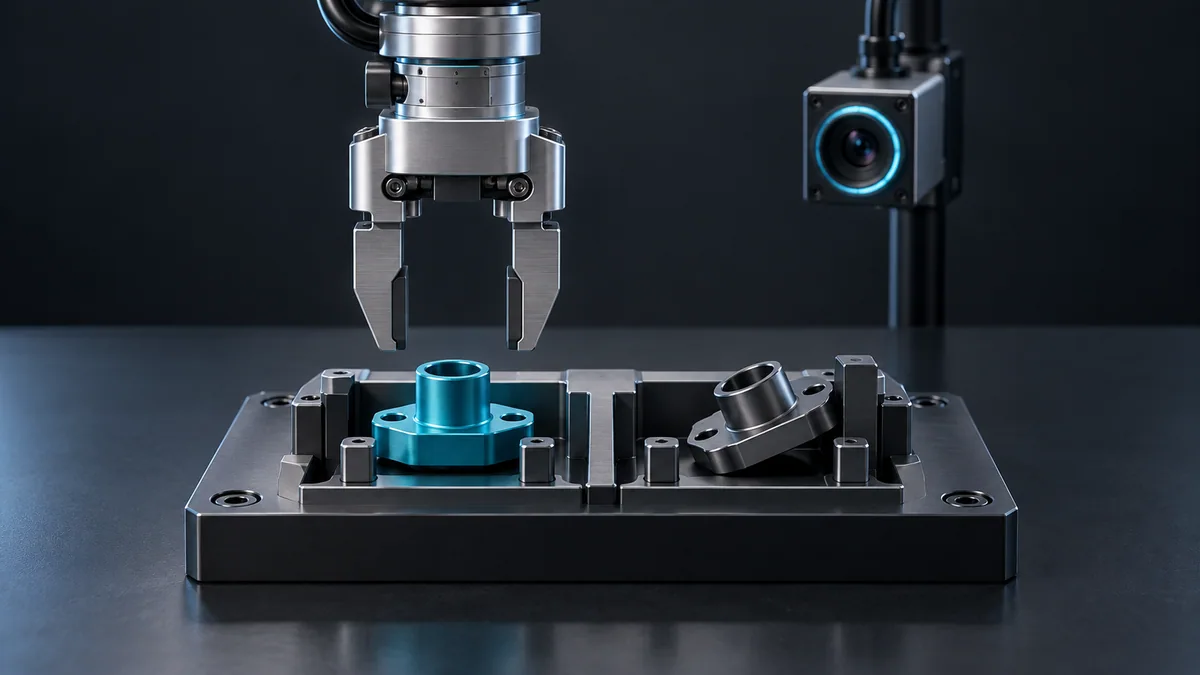
- Test approach feasibility and gripper clearance, then verify the actual placed-part outcome rather than trusting the detector label.
- Freeze configuration and report success, coverage, failure reasons and latency on the independent test set.
How to check the result
Every invalid case must end in a documented reject or fault state. Preserve enough logs to connect each image with the resulting target and outcome.
Common mistake to avoid
High detection accuracy cannot compensate for an incorrect coordinate transform. Camera-based process logic must never be the only protection for people.
Reference reading
Primary references for the underlying models, APIs or application context. The worked numbers and plots above are educational calculations, not results reported by these sources.