What you need
Use component datasheets and measured currents from a current-limited bench setup. Have mains-side installation handled by qualified personnel.
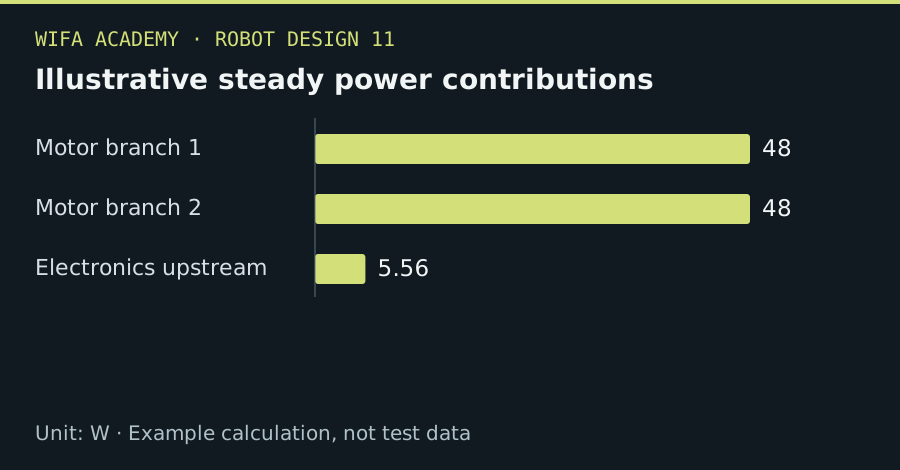
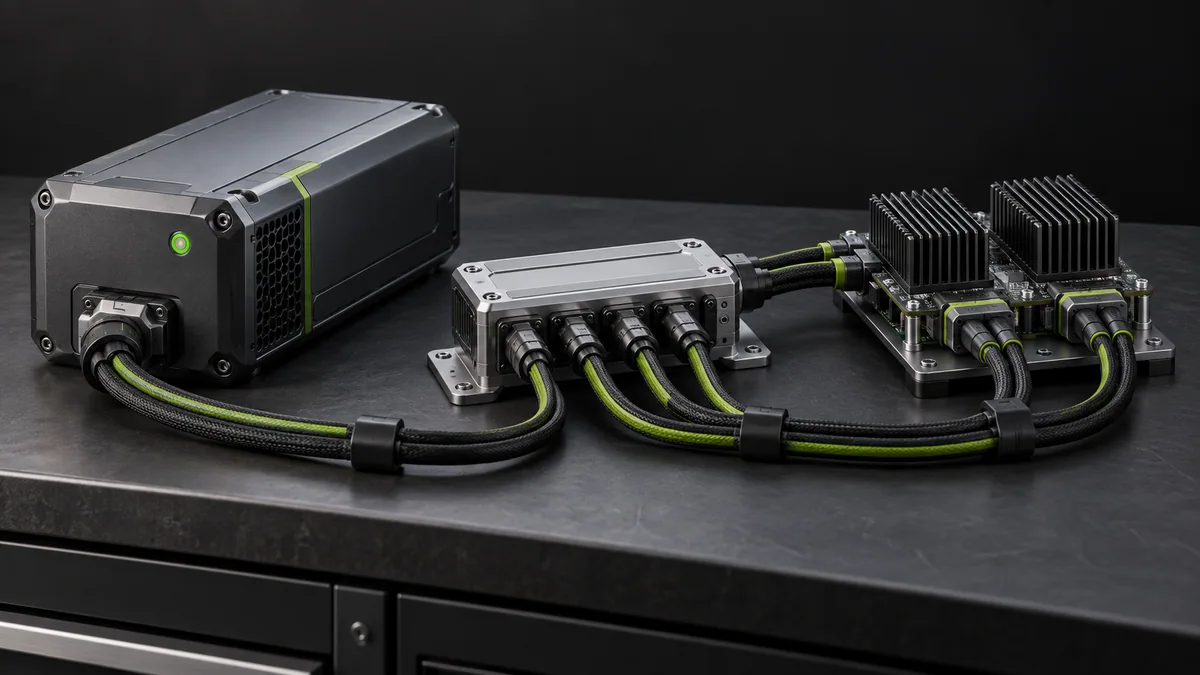
Read the diagram as a data table
| Condition or component | W |
|---|---|
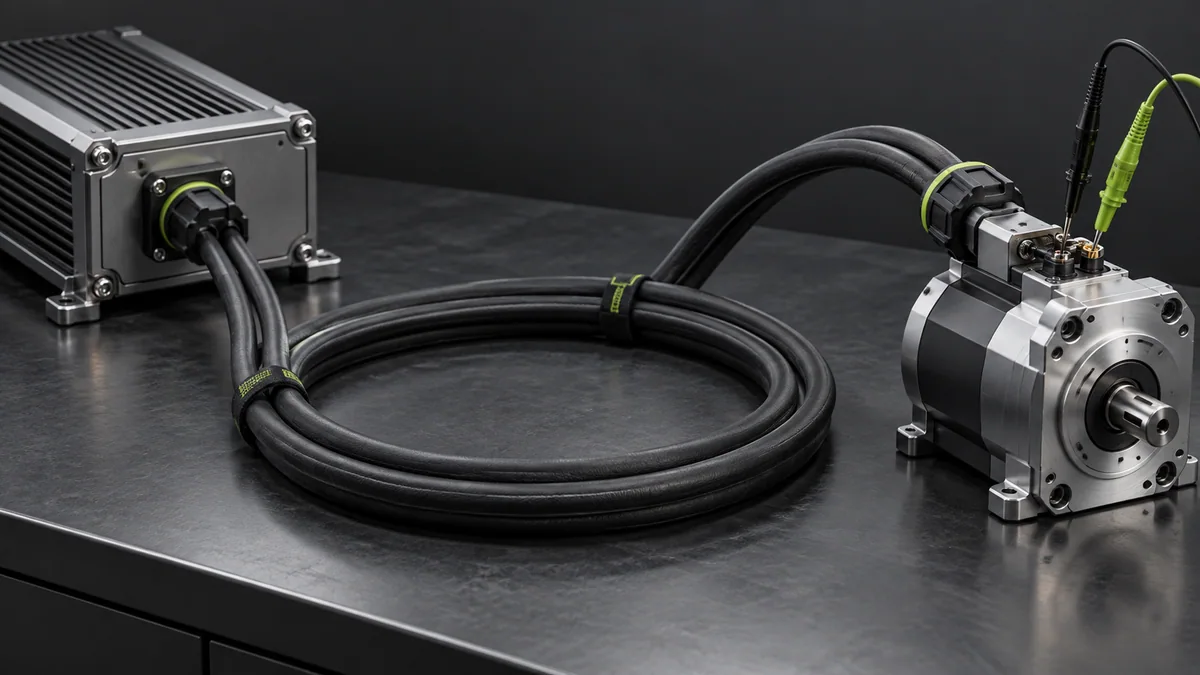
| Motor branch 1 | 48 |
| Motor branch 2 | 48 |
| Electronics upstream | 5.56 |
The calculation
P_load = ΣV_i I_i
P_input ≈ P_output / η
Power is W, voltage V and current A. The efficiency equation applies to the relevant converter, not automatically to every load.
Worked example
Two 24 V branches drawing 2 A each use 96 W. A 5 V electronics branch drawing 1 A uses 5 W; at 90% conversion efficiency it draws about 5.56 W upstream. The illustrative steady total is 101.56 W, excluding peaks.
Try it step by step
- List each rail, load, steady current and plausible peak current with its source and operating condition.
- Account for converter losses and simultaneous loads without adding incompatible voltage-domain currents directly.
- Check inrush, motor-drive peak behavior and regenerative energy handling against supply and drive documentation.
- Provide appropriate branch protection and measure voltage and current during a restrained representative test.
How to check the result
The supply and distribution must stay within ratings during the complete load profile, not merely while the controller is idle.
Common mistake to avoid
A large supply current rating does not protect small wires or connectors. Protection must suit the branch and the relevant installation requirements.
Reference reading
Primary references for the underlying models, APIs or application context. The worked numbers and plots above are educational calculations, not results reported by these sources.