What you need
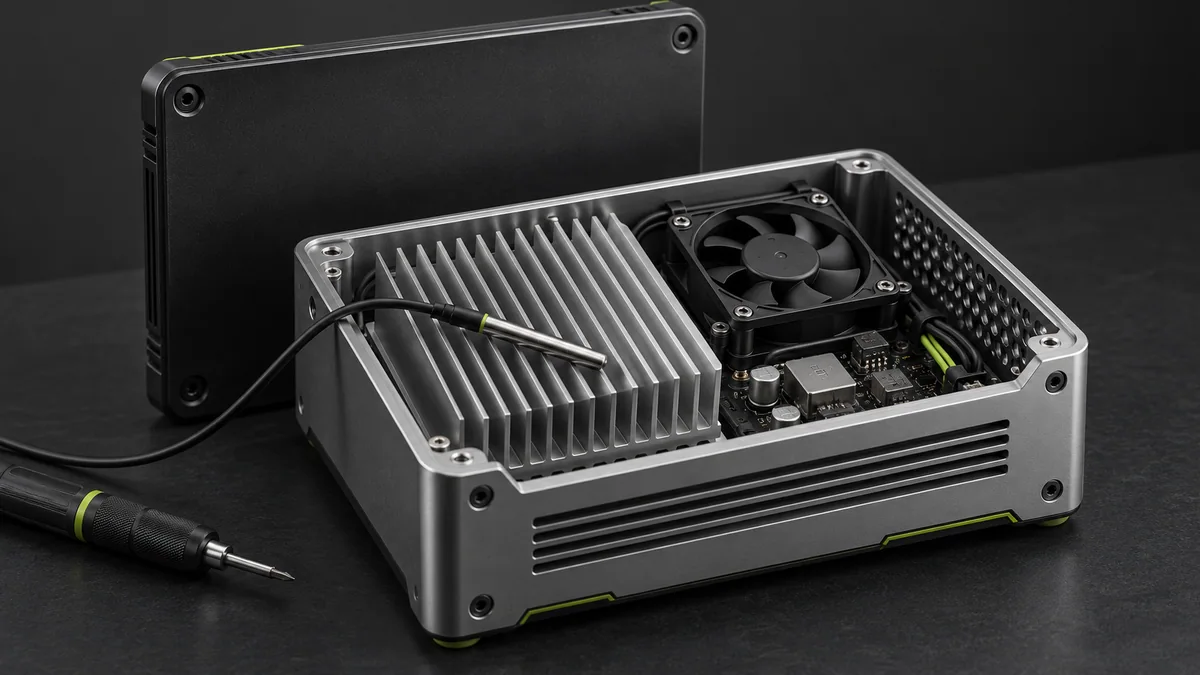
Use component power loss, datasheet thermal information and ambient-temperature requirements. Avoid touching energized hot assemblies.
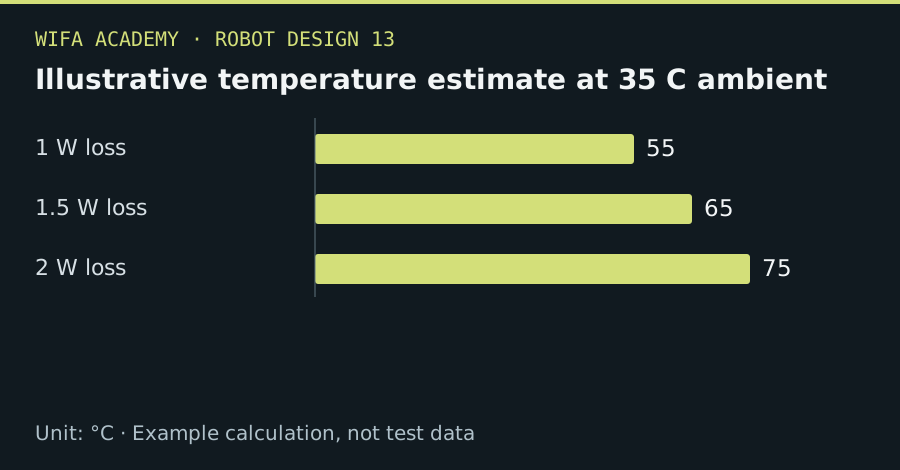
Read the diagram as a data table
| Condition or component | °C |
|---|---|
| 1 W loss | 55 |
| 1.5 W loss | 65 |
| 2 W loss | 75 |
The calculation
ΔT ≈ P_loss × R_thermal
T_estimated = T_ambient + ΔT
P_loss is W and R_thermal is °C/W for the defined thermal path. Datasheet board conditions may differ greatly from your assembly.
Worked example
A 2 W loss through an illustrative 20°C/W path raises temperature by about 40°C. At 35°C ambient, the estimate is 75°C. Reducing loss to 1 W gives about 55°C under the same assumed path.
Try it step by step
- Identify heat-producing components and estimate losses at the actual duty cycle, including conversion and drive losses.
- Check what the datasheet thermal resistance measures and whether the assumed board and airflow match your design.
- Measure temperatures in the representative enclosure over enough time to approach thermal equilibrium.
- Improve efficiency, heat paths or ventilation while maintaining electrical insulation and mechanical protection.
How to check the result
Record ambient, load, airflow and measurement location. Compare against the relevant component limits with an appropriate design margin.
Common mistake to avoid
A case temperature is not automatically junction temperature. One nominal thermal resistance cannot represent every mounting and transient condition.
Reference reading
Primary references for the underlying models, APIs or application context. The worked numbers and plots above are educational calculations, not results reported by these sources.