What you need
Use a simulator, path distance and a chosen acceleration below all relevant machine limits. Ignore hardware operation until the path is reviewed.
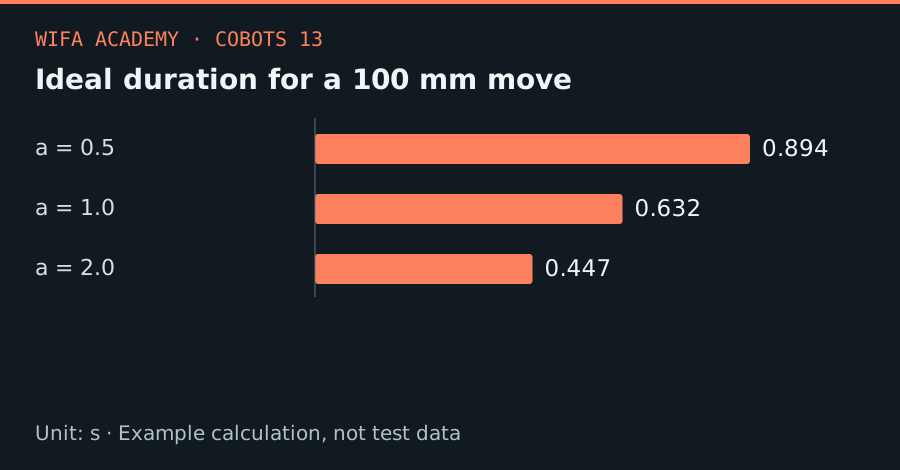
Read the diagram as a data table
| Condition or component | s |
|---|---|
| a = 0.5 | 0.894 |
| a = 1.0 | 0.632 |
| a = 2.0 | 0.447 |
The calculation
d_switch = v_max² / a
t_triangular = 2 × √(d / a)
d is travel in m, a is acceleration in m/s² and v_max is m/s. The model assumes symmetric acceleration, zero end speeds and no jerk limit.
Worked example
For a 0.10 m move at 1 m/s², the peak speed is √0.1 = 0.316 m/s and time is 0.632 s. A 1 m/s speed limit is never reached. At 0.5 m/s², time increases to 0.894 s.
Try it step by step
- Extract the actual path distance rather than the straight-line target separation if the controller follows a curved path.
- Compare distance with v_max²/a to determine whether a cruise segment can exist in this idealized model.
- Calculate a baseline and compare it with simulated timing to expose jerk limits, blending and joint constraints.
- Optimize path length and unnecessary stops before raising acceleration, and keep the validated load and safety limits unchanged.
How to check the result
Check predicted peak velocity and duration against a controller trace. Document why real timing is longer rather than hiding the difference.
Common mistake to avoid
Cartesian acceleration does not directly equal every joint’s acceleration. Jerk limits and orientation changes can dominate actual motion.
Reference reading
Primary references for the underlying models, APIs or application context. The worked numbers and plots above are educational calculations, not results reported by these sources.