What you need
Prepare a trial sheet covering representative parts, shifts, changeovers and documented operating conditions. Complete required safety validation separately.
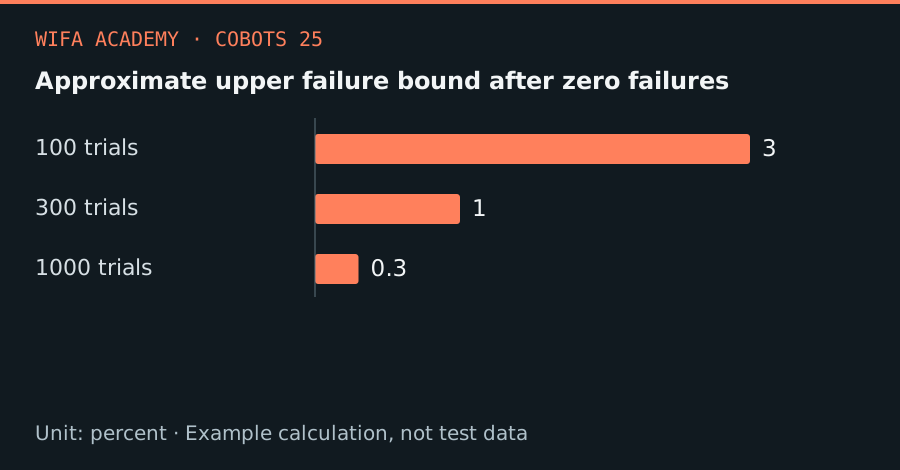
Read the diagram as a data table
| Condition or component | percent |
|---|---|
| 100 trials | 3 |
| 300 trials | 1 |
| 1000 trials | 0.3 |
The calculation
p_upper ≈ 3 / n
For zero failures in n independent Bernoulli trials, the rule of three approximates a one-sided 95% upper bound. It is unsuitable for correlated failures.
Worked example
Zero failures in 100 trials gives an approximate upper bound of 3%; zero in 1,000 gives 0.3%. Neither proves zero risk. Testing only easy parts or repeating the same favorable condition gives a poor picture of production behavior.
Try it step by step
- Write measurable acceptance conditions for good output, placement error, recovery behavior and permitted process faults before the run.
- Include expected part variants and transitions, and record environmental and tooling conditions alongside every result.
- Keep process capability evidence separate from machinery-safety validation; a large successful sample does not certify safeguarding.
- Report trial count, observed failures, uncertainty and untested conditions, then assign owners for unresolved issues before release.
How to check the result
A reviewer should be able to reproduce the summary from raw trials and identify exactly which operating conditions were not covered.
Common mistake to avoid
The approximation is a statistical teaching aid, not a release rule. Common-cause failures and changing process conditions violate its assumptions.
Reference reading
Primary references for the underlying models, APIs or application context. The worked numbers and plots above are educational calculations, not results reported by these sources.