What you need
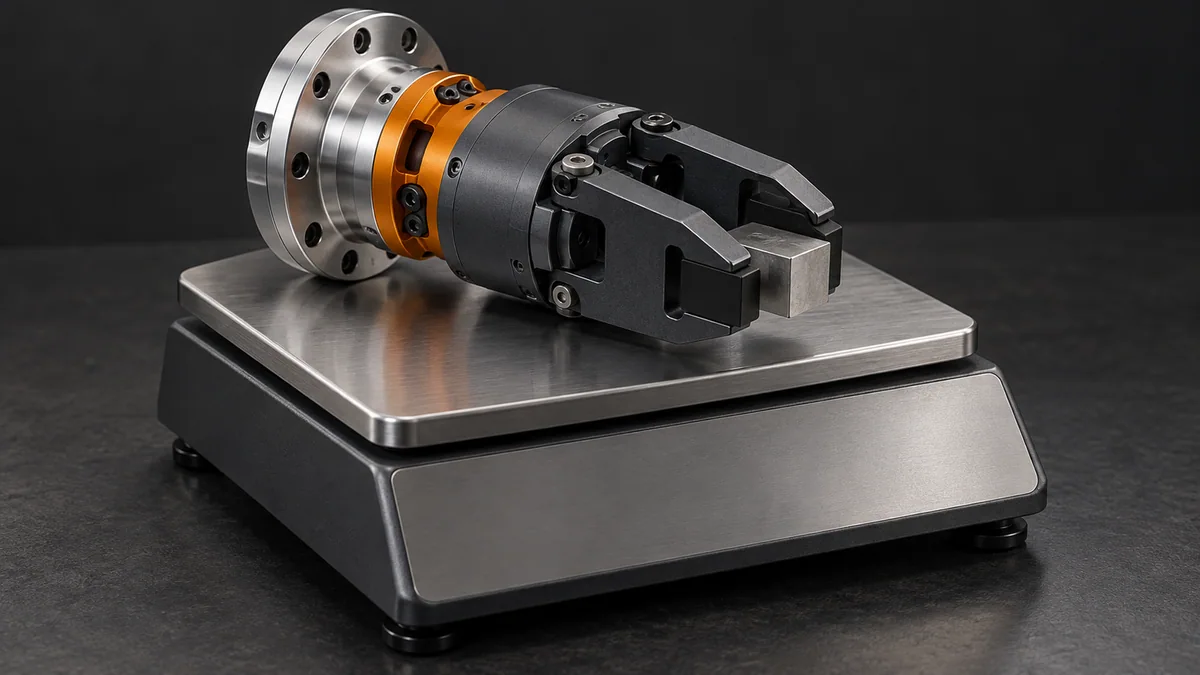
Collect a scale, tooling drawings and the selected robot’s payload and inertia documentation. Work with the equipment unpowered.
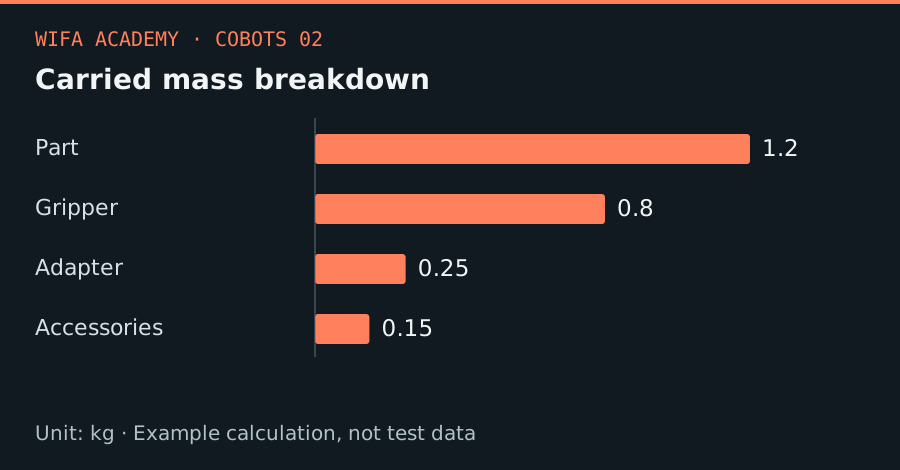
Read the diagram as a data table
| Condition or component | kg |
|---|---|
| Part | 1.2 |
| Gripper | 0.8 |
| Adapter | 0.25 |
| Accessories | 0.15 |
The calculation
m_total = m_part + m_gripper + m_adapter + m_accessories
m is mass in kg. This mass sum is necessary but does not verify allowable center of gravity, inertia or dynamic loads.
Worked example
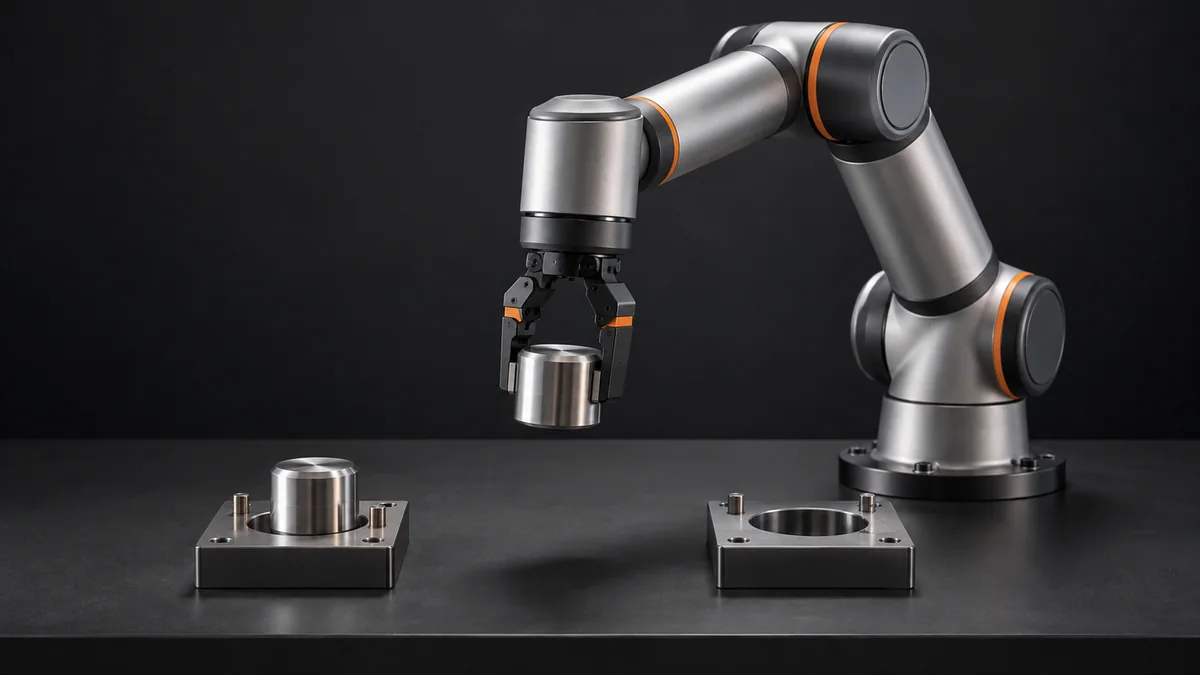
A 1.2 kg part, 0.8 kg gripper, 0.25 kg adapter and 0.15 kg carried accessories total 2.4 kg. A nominal 3 kg payload rating leaves 0.6 kg by mass only. It is not an approval to operate at every pose and acceleration.
Try it step by step
- Weigh each carried component, including the worst-case part variant, and record the source of every mass estimate.
- Define empty-tool and loaded-tool states separately; the controller needs the correct state at the correct time.
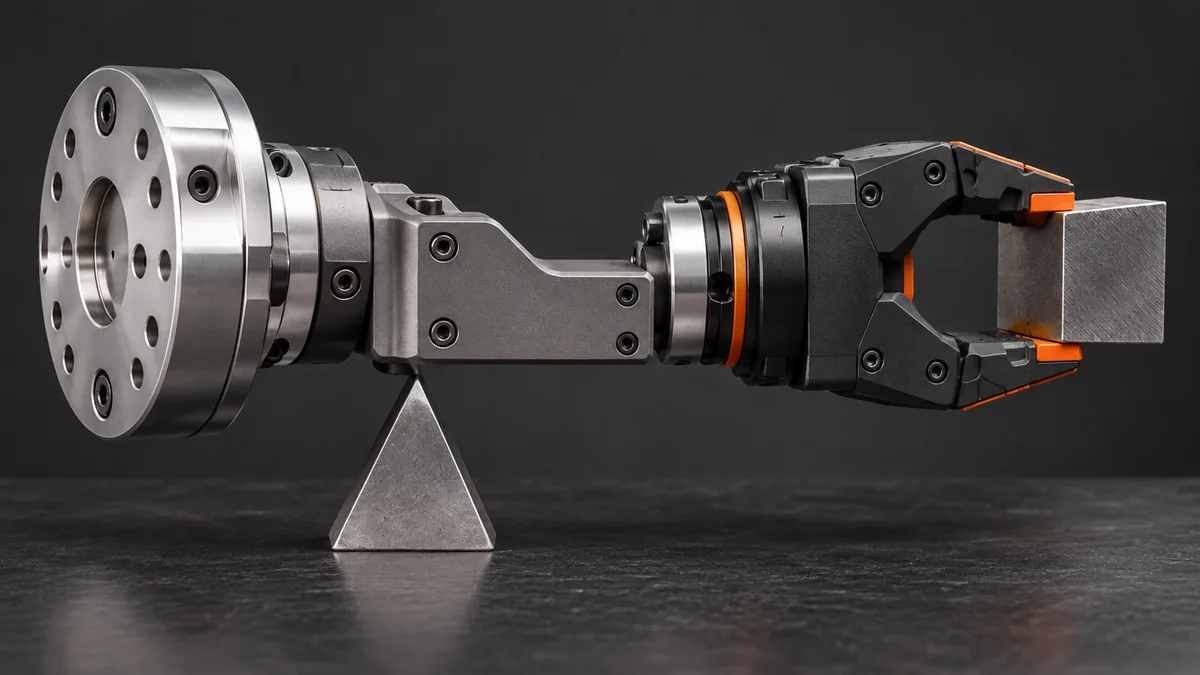
- Locate component centers of gravity relative to the flange and compare the complete assembly with the manufacturer’s permitted load envelope.
- Check permitted moments and inertias, then simulate the demanding poses before a supervised reduced-speed test.
How to check the result
Reweigh the assembled tooling and check the installed payload configuration against the worksheet after any tool change.
Common mistake to avoid
A percentage mass margin cannot substitute for the manufacturer’s load diagram. Long tools can exceed moment limits while remaining under the mass rating.
Reference reading
Primary references for the underlying models, APIs or application context. The worked numbers and plots above are educational calculations, not results reported by these sources.