What you need
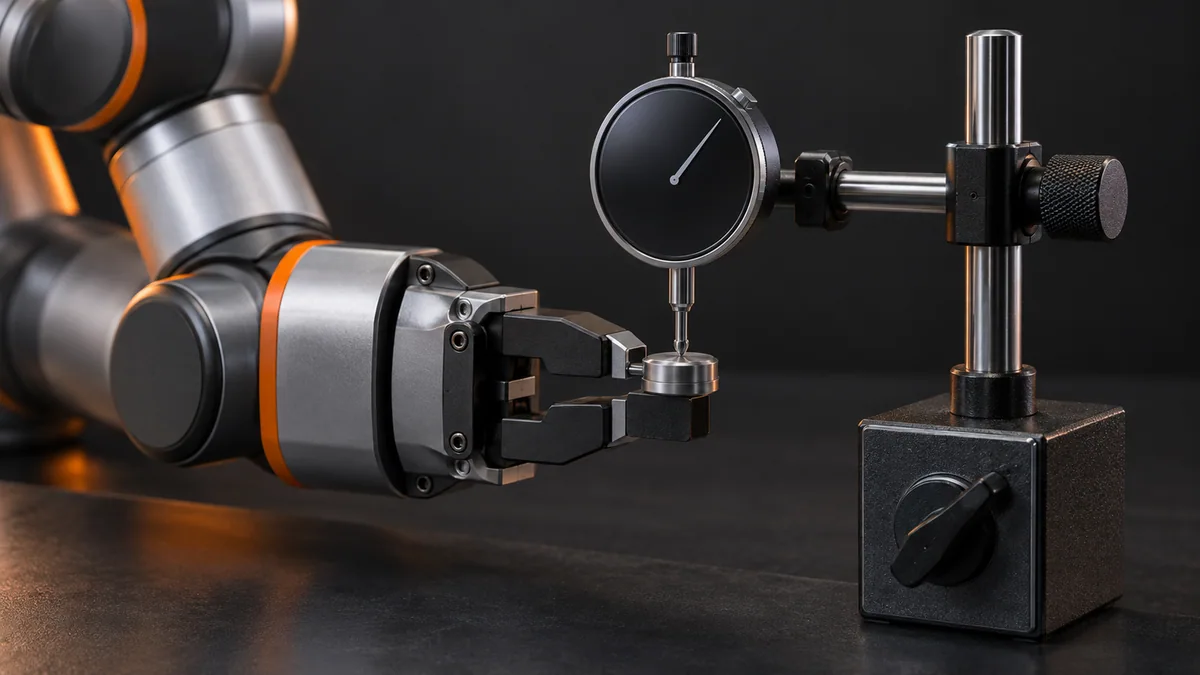
Use a dial indicator or other suitable measuring instrument and a stable fixture. Record a single defined approach direction and payload.
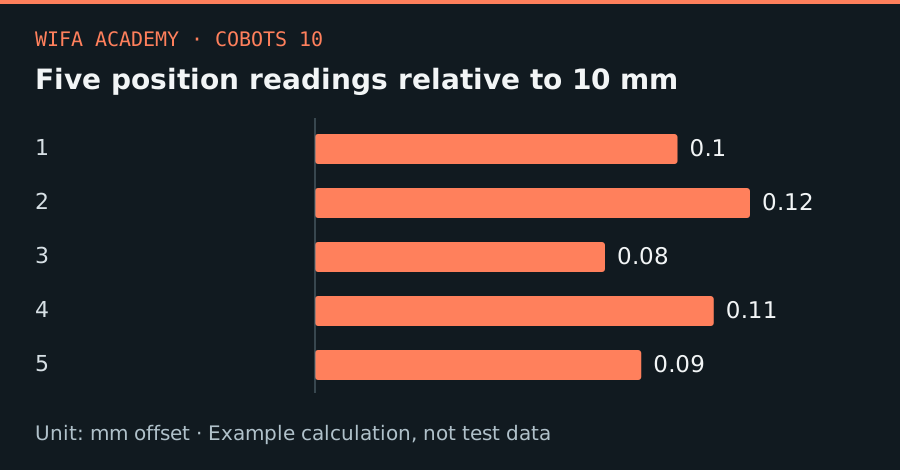
Read the diagram as a data table
| Condition or component | mm offset |
|---|---|
| 1 | 0.1 |
| 2 | 0.12 |
| 3 | 0.08 |
| 4 | 0.11 |
| 5 | 0.09 |
The calculation
x̄ = Σx_i / n
s = √[Σ(x_i − x̄)² / (n − 1)]
bias = x̄ − x_target
x_i is a measured position in mm, n is the sample count and s is sample standard deviation. This is not an ISO acceptance test.
Worked example
For positions 10.10, 10.12, 10.08, 10.11 and 10.09 mm, the mean is 10.10 mm and s is about 0.0158 mm. Against a 10.00 mm target, bias is +0.10 mm. Small scatter has not removed the offset.
Try it step by step
- Stabilize the mount and instrument, warm up using the manufacturer’s guidance and record the tool and payload state.
- Collect repeated approaches without changing the target, then repeat at another workspace location rather than extrapolating one result.
- Calculate mean, spread and target offset separately, retaining raw measurements and instrument resolution.
- Repeat from another approach direction to expose backlash or compliance; do not silently merge different test conditions.
How to check the result
Your report should identify instrument uncertainty, approach direction, thermal state and sample count alongside the statistics.
Common mistake to avoid
Five readings illustrate arithmetic, not a full qualification. Report the actual test conditions instead of advertising this result as the robot’s certified repeatability.
Reference reading
Primary references for the underlying models, APIs or application context. The worked numbers and plots above are educational calculations, not results reported by these sources.