What you need
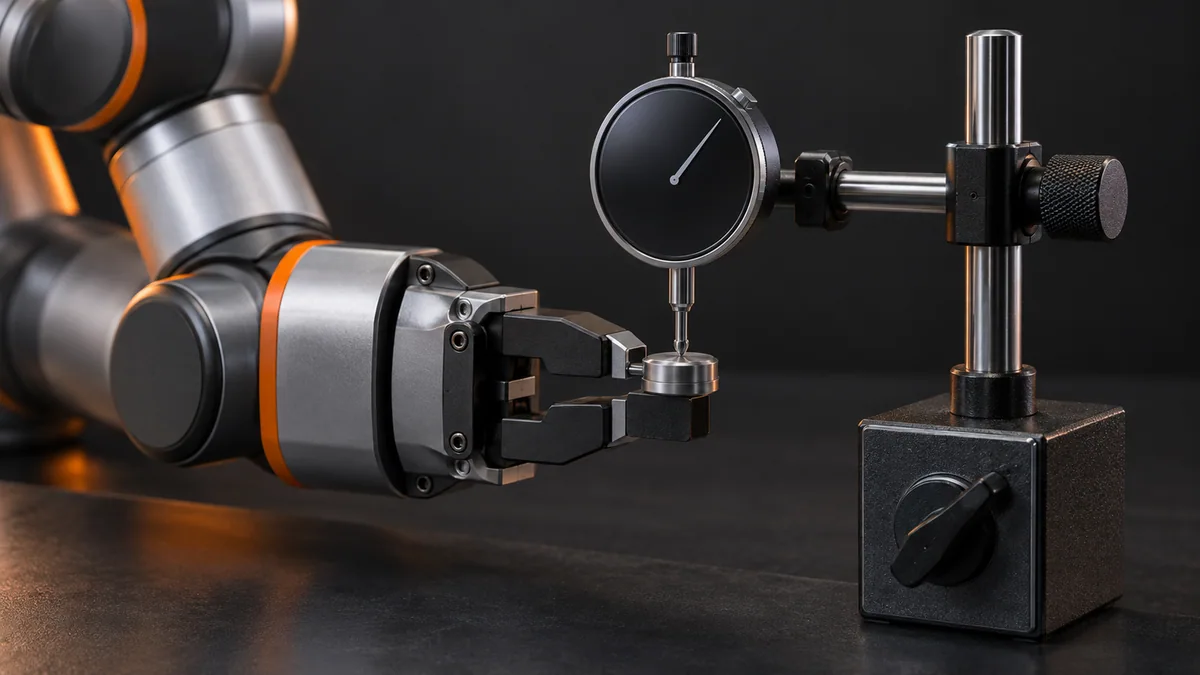
List the part clearance and measured uncertainty contributions in one coordinate direction. Include the measurement method for each number.
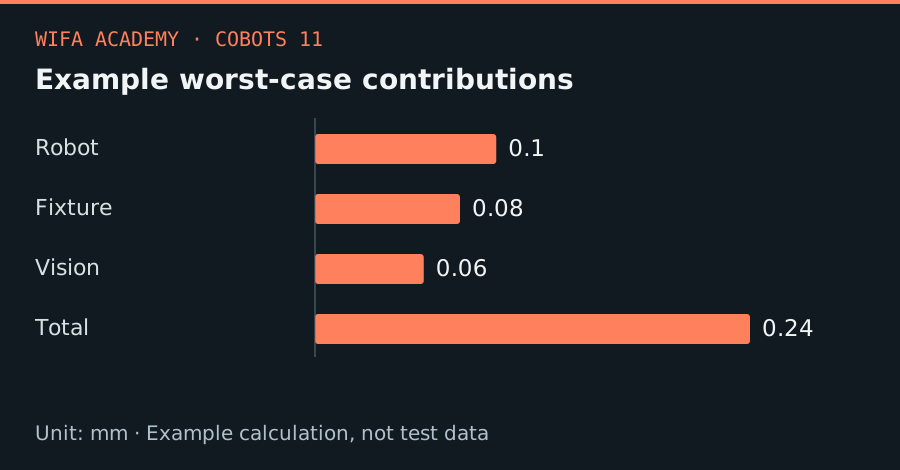
Read the diagram as a data table
| Condition or component | mm |
|---|---|
| Robot | 0.1 |
| Fixture | 0.08 |
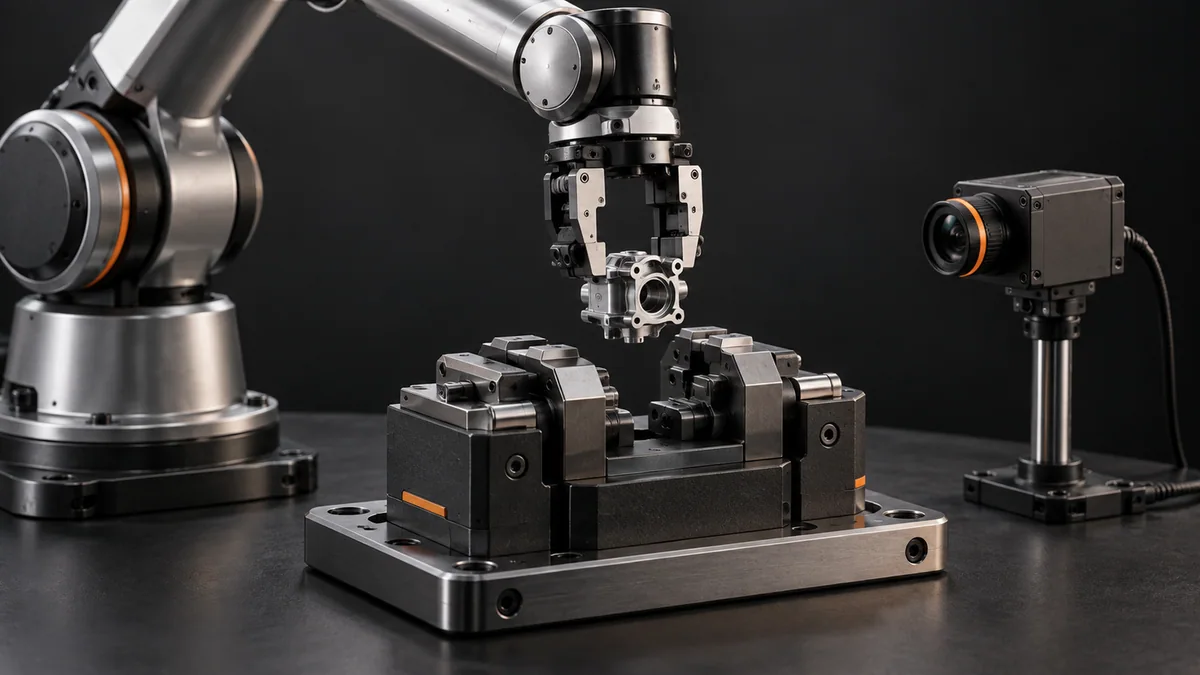
| Vision | 0.06 |
| Total | 0.24 |
The calculation
e_worst = Σ|e_i|
σ_total = √(σ_1² + σ_2² + …)
The first expression combines worst-case bounds. The second combines independent, zero-mean standard uncertainties; do not mix the two interpretations.
Worked example
Bounds of 0.10 mm for robot positioning, 0.08 mm for a fixture and 0.06 mm for vision add to 0.24 mm worst-case. If these were instead independent standard uncertainties, their root-sum-square would be 0.141 mm. The interpretations are not interchangeable.
Try it step by step
- Define the actual acceptance direction: radial clearance, angular alignment and insertion depth usually need separate checks.
- Classify each contribution as a bias, bounded tolerance or random variation before choosing a combination rule.
- Measure large contributors first; improving a tiny camera error will not compensate for a loose fixture.
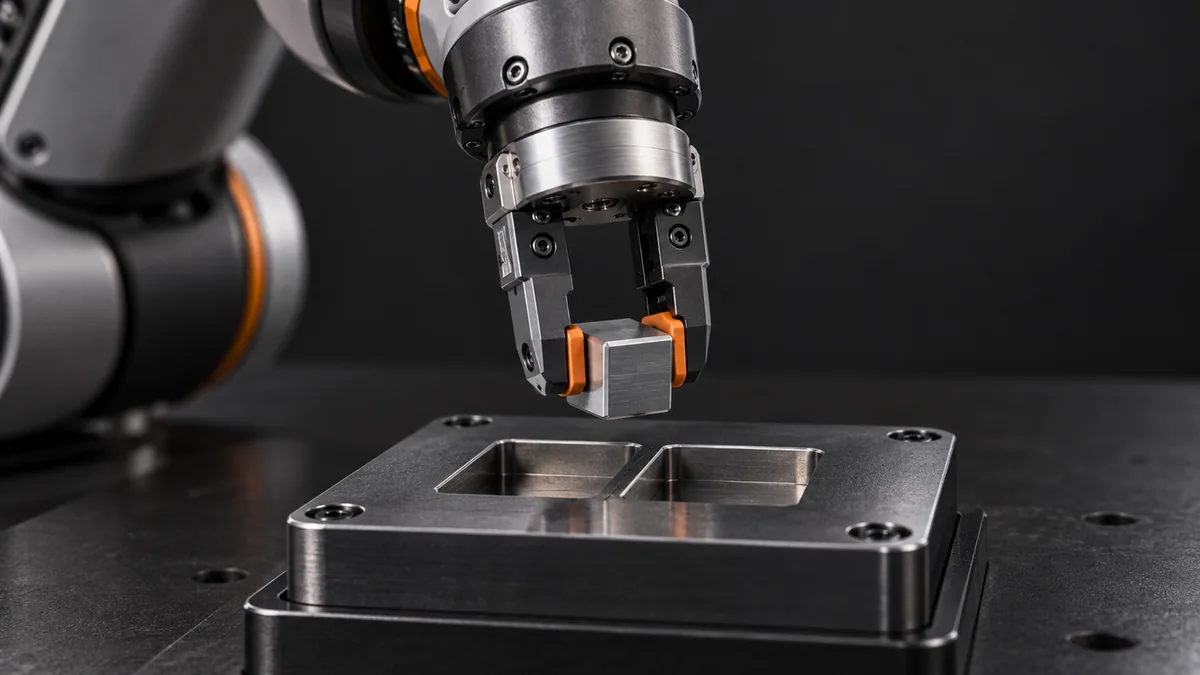
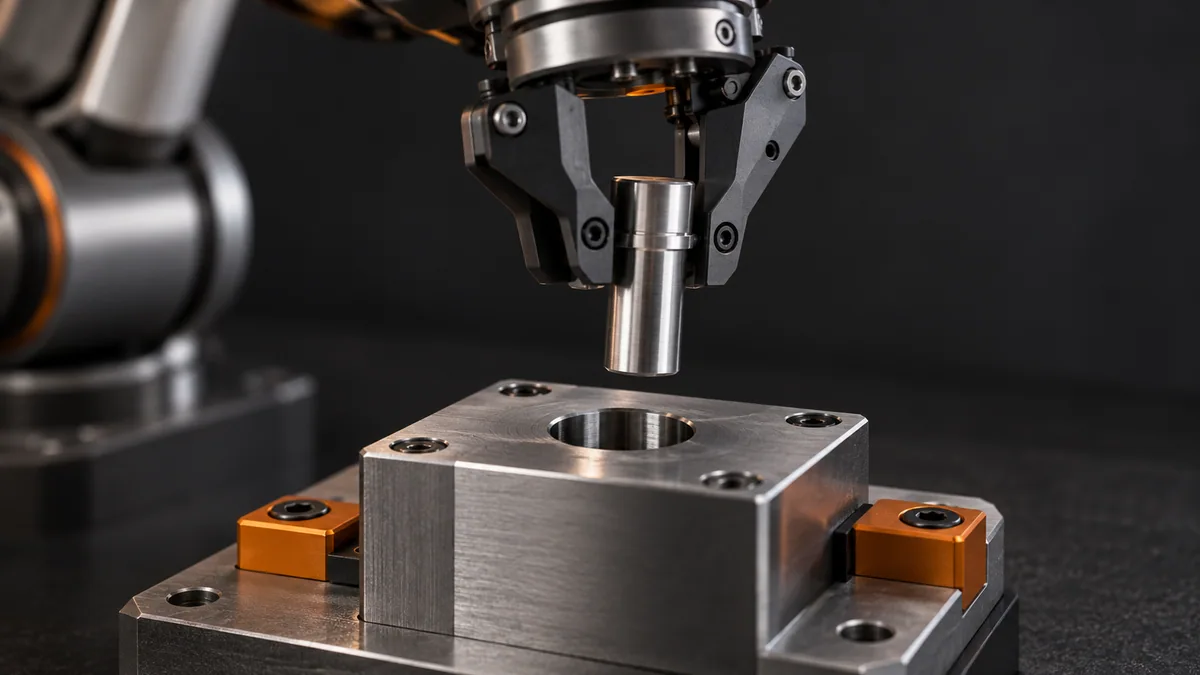
- Test demanding tolerance combinations with representative parts and an appropriate compliant or guarded insertion strategy.
How to check the result
Compare the predicted budget with observed residuals on parts not used for tuning. Investigate any systematic trend with pose or temperature.
Common mistake to avoid
Root-sum-square can underestimate risk when errors are correlated or are hard limits rather than standard deviations.
Reference reading
Primary references for the underlying models, APIs or application context. The worked numbers and plots above are educational calculations, not results reported by these sources.