What you need
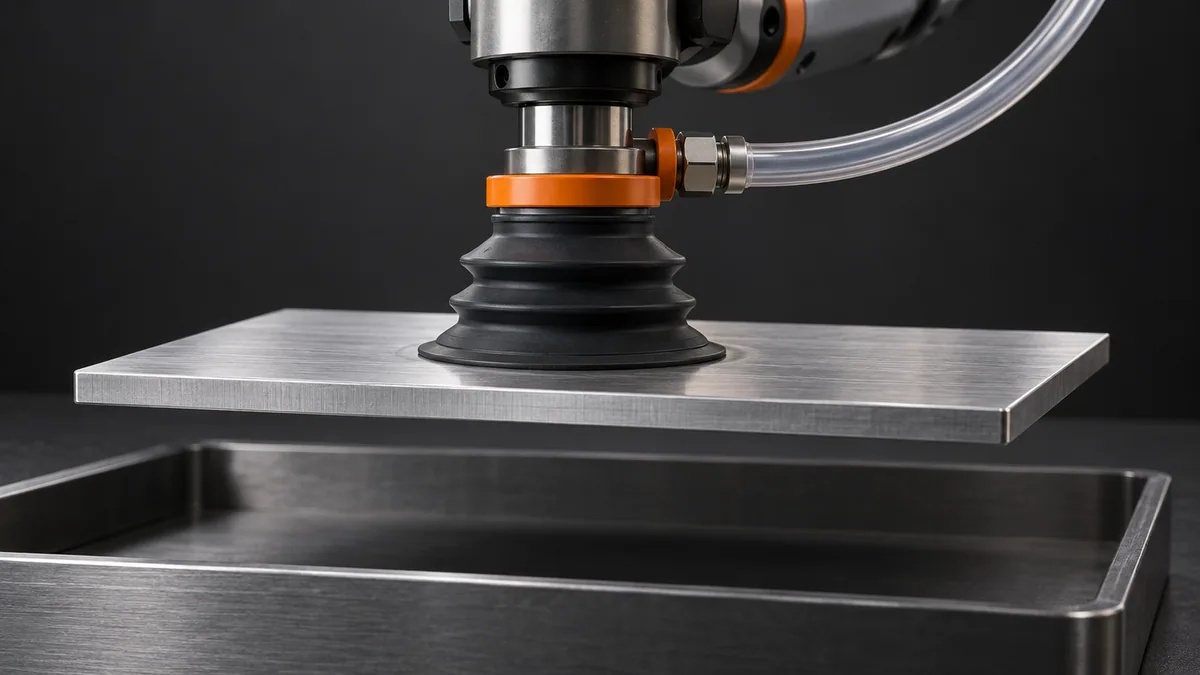
Use the cup’s effective area, a vacuum gauge near the tool and representative surface samples. Contain all possible drops.
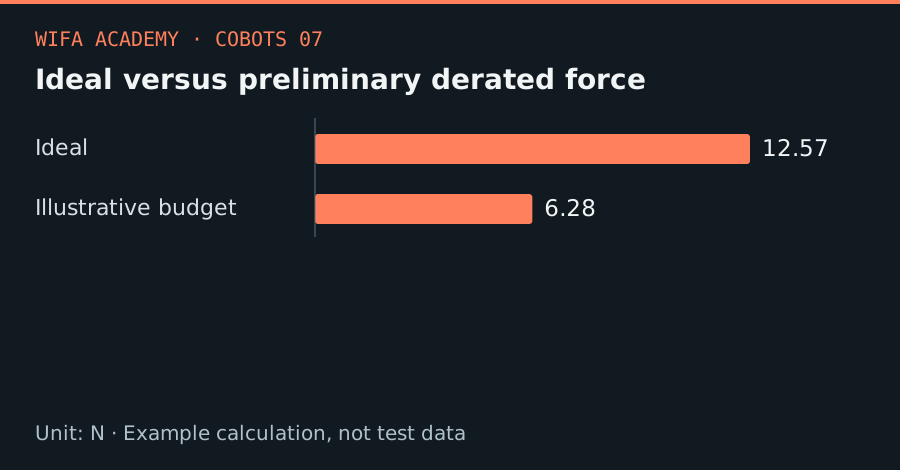
Read the diagram as a data table
| Condition or component | N |
|---|---|
| Ideal | 12.57 |
| Illustrative budget | 6.28 |
The calculation
F_ideal = Δp × A
F_budget = η × F_ideal
Δp is pressure difference in Pa; A is effective area in m²; η is an illustrative derating factor, not a certified safety factor.
Worked example
A 20 mm effective-diameter cup has area π×0.01² = 0.000314 m². At a 40 kPa pressure difference it produces 12.57 N ideally. An illustrative 0.5 derating leaves 6.28 N for preliminary comparison, before checking dynamics and application requirements.
Try it step by step
- Measure achievable vacuum at the cup with the actual part surface, not only at the pump under a sealed test condition.
- Use the supplier’s effective area and permissible load directions; peeling and sideways sliding differ from normal pull-off.
- Include hoses, valves, leaks and evacuation time in the test, and confirm that vacuum is established before lifting.
- Design loss-of-vacuum handling and part containment, then test demanding parts and accelerations under an approved procedure.
How to check the result
Log vacuum through the complete cycle and verify the minimum level during motion and dwell, including the expected leak condition.
Common mistake to avoid
Multiplying catalog cup diameter by pump vacuum can overestimate holding force. Multiple cups do not necessarily share the load equally.
Reference reading
Primary references for the underlying models, APIs or application context. The worked numbers and plots above are educational calculations, not results reported by these sources.