What you need
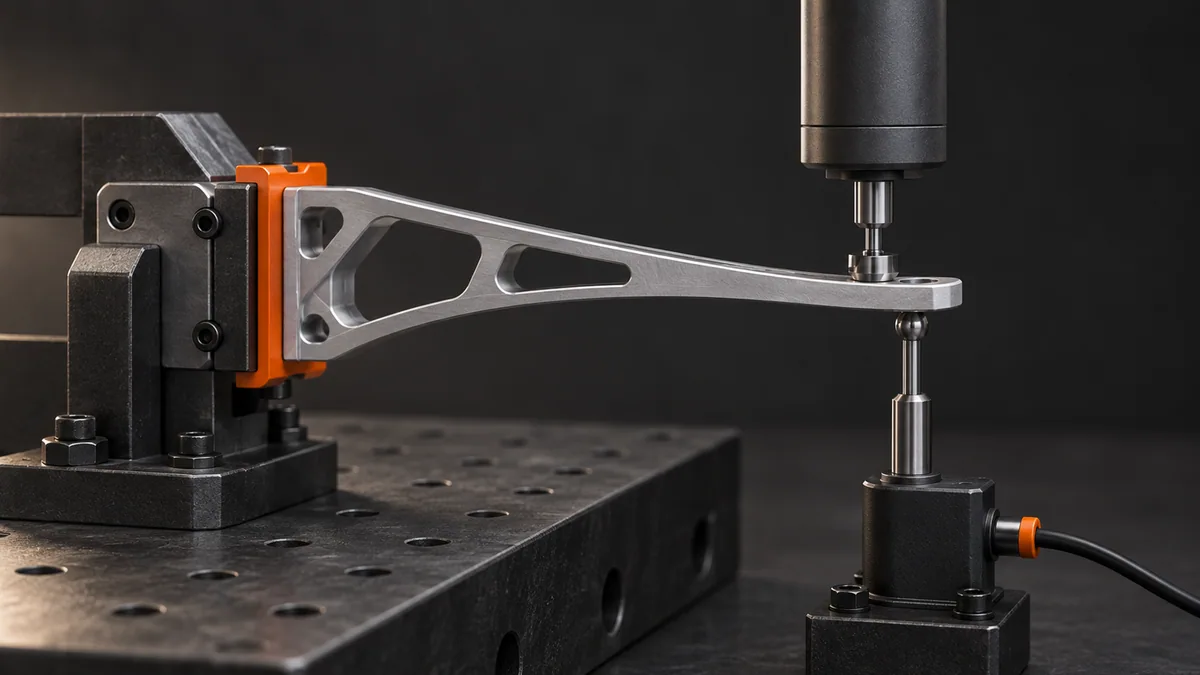
Use a suitable force gauge, displacement indicator and a securely restrained test fixture. Stay within the assembly’s documented elastic load range.
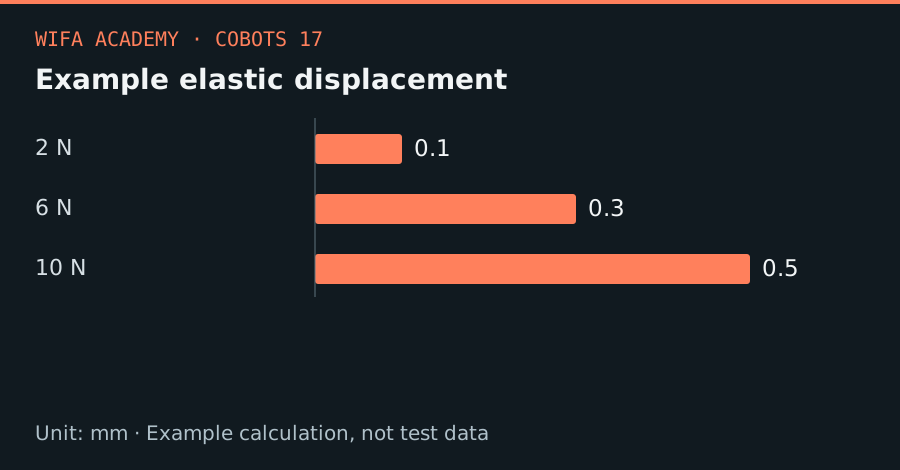
Read the diagram as a data table
| Condition or component | mm |
|---|---|
| 2 N | 0.1 |
| 6 N | 0.3 |
| 10 N | 0.5 |
The calculation
k_eff = ΔF / Δx
δ_predicted = F / k_eff
k_eff is N/mm, force is N and displacement is mm. This approximation assumes linear elastic behavior in the tested direction.
Worked example
If increasing load from 2 N to 10 N changes displacement from 0.10 to 0.50 mm, k_eff = 8/0.4 = 20 N/mm. A 6 N load would then predict 0.30 mm displacement, provided the zero-load offset is removed.
Try it step by step
- Measure displacement at the actual process point, with the mounting and finger length used in production.
- Apply several controlled loads in a safe restrained fixture and record both loading and unloading values.
- Subtract the initial offset, fit a slope over the relevant range and inspect whether the relationship is approximately linear.
- Repeat in other important directions; redesign weak geometry before adding compensation that only works for one load.
How to check the result
Unloading should return close to the initial position. Large hysteresis or a permanent offset indicates the linear elastic model is inadequate.
Common mistake to avoid
Compliance can come from joints, mounts and contact surfaces, not just the visible finger. Do not extend a low-load linear fit into yielding or buckling.
Reference reading
Primary references for the underlying models, APIs or application context. The worked numbers and plots above are educational calculations, not results reported by these sources.