What you need
Use an offline worksheet and hypothetical motion parameters. Actual safeguarding requires manufacturer stopping data and application-specific validation.
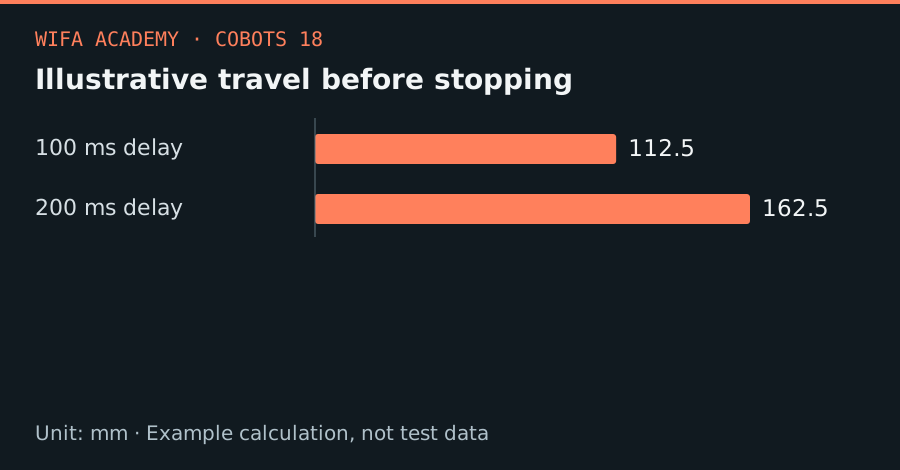
Read the diagram as a data table
| Condition or component | mm |
|---|---|
| 100 ms delay | 112.5 |
| 200 ms delay | 162.5 |
The calculation
d_model = v × t_delay + v² / (2 × a)
v is m/s, t_delay is s and a is constant deceleration magnitude in m/s². The model omits many real stopping and human-approach effects.
Worked example
At 0.5 m/s with 0.10 s delay and 2 m/s² deceleration, the delay contributes 0.050 m and ideal braking 0.0625 m: total 0.1125 m. Increasing delay to 0.20 s gives 0.1625 m. These are illustrative travel distances only.
Try it step by step
- Separate sensing, communications, controller reaction and mechanical stopping in a timing diagram rather than assuming an instantaneous response.
- Calculate the simple model to see which term dominates at several speeds and delays.
- For a real application, obtain stopping-performance information for the actual robot, load, pose and configured safety function.
- Have the complete protective system assessed and validated by a competent person; keep ordinary camera or PLC timing out of safety-rated assumptions.
How to check the result
The learning result is a sensitivity calculation. A real safety report needs validated system data, uncertainties and the applicable standard’s method.
Common mistake to avoid
Never use this number as a minimum human separation distance. It excludes human approach, intrusion, measurement uncertainty and nonconstant braking.
Reference reading
Primary references for the underlying models, APIs or application context. The worked numbers and plots above are educational calculations, not results reported by these sources.