What you need
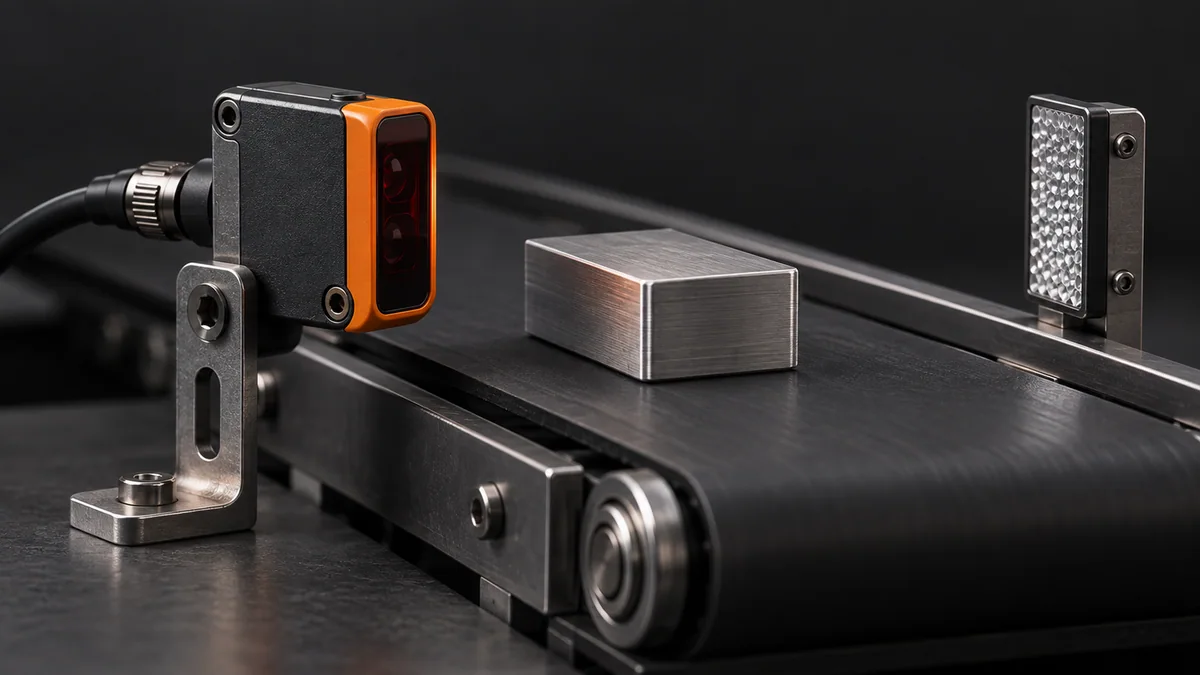
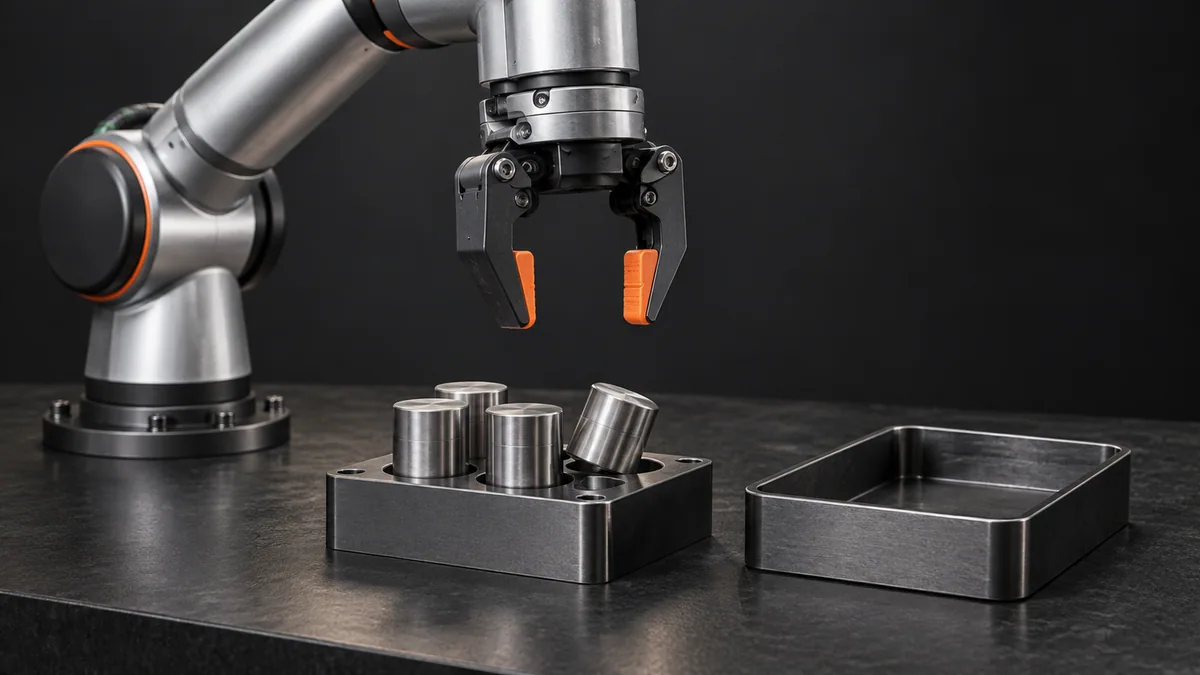
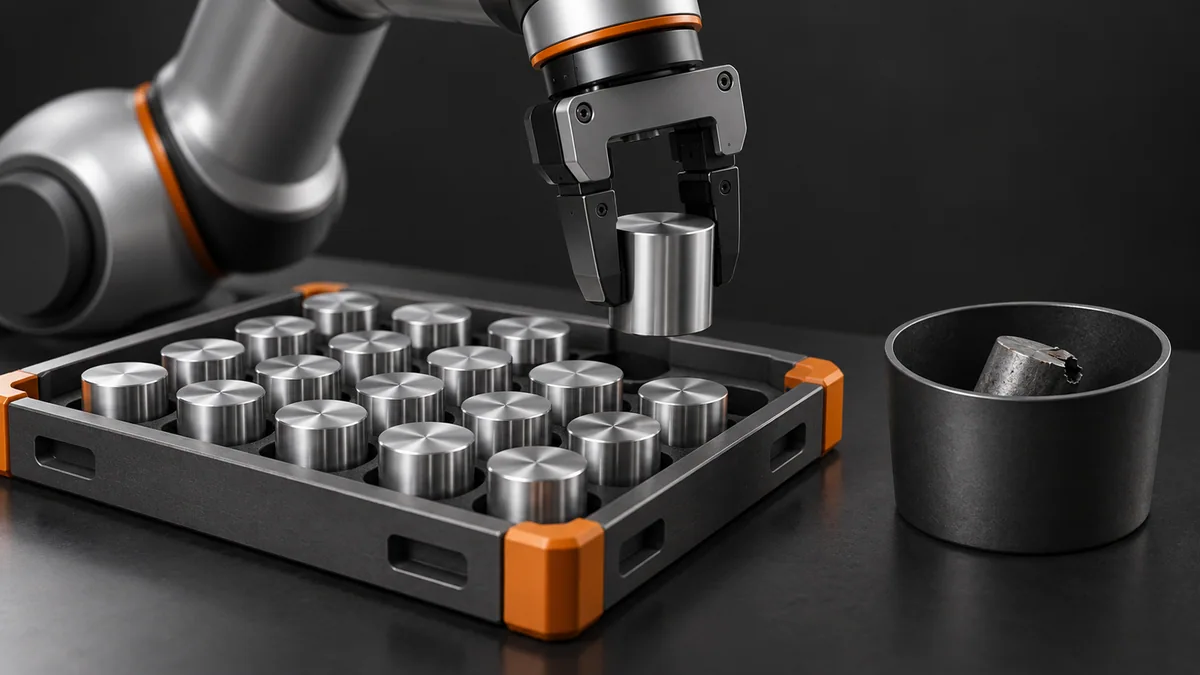
Use simulated sensor states first, then a contained fixture with representative good, missing and badly seated parts.
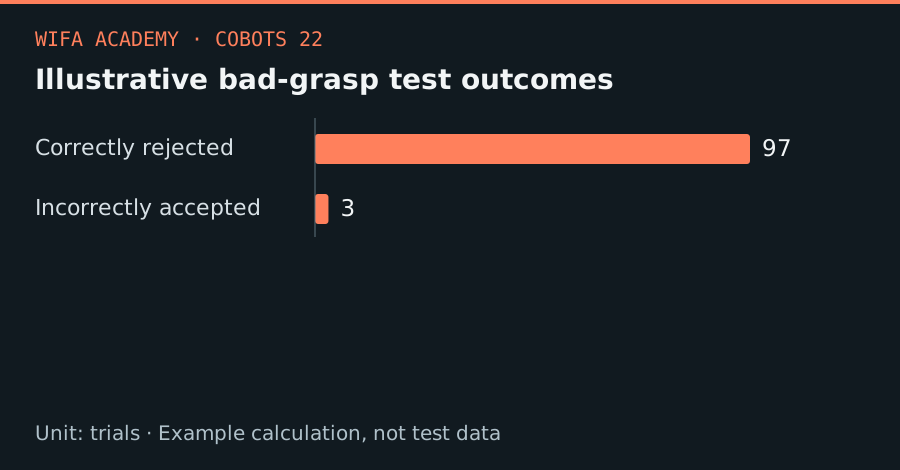
Read the diagram as a data table
| Condition or component | trials |
|---|---|
| Correctly rejected | 97 |
| Incorrectly accepted | 3 |
The calculation
false_accept_rate = false_accepts / actual_bad_trials
Count a false accept when a missing or bad grasp is incorrectly accepted. Keep bad-trial and good-trial denominators separate.
Worked example
If 100 deliberately bad trials include 3 accepted grasps, the false-accept rate is 3%. If 100 good trials include 5 rejected grasps, the false-reject rate is 5%. One combined 96% accuracy number would hide the different consequences.
Try it step by step
- Define acceptable jaw-position or vacuum ranges using representative parts and document which abnormal conditions must be detected.
- Collect separate good and deliberately bad test sets, including partial seating, missing parts and delayed sensor updates.
- Require evidence associated with the current grasp and handle contradictory sensor readings explicitly.
- Record false accepts and false rejects separately, then review thresholds against the process consequences before a supervised pilot.
How to check the result
The validation record should show each fault type tested, the evidence observed and the resulting state, not just an overall success percentage.
Common mistake to avoid
Two sensors can share one failure cause, such as a disconnected common supply. Process confirmation does not make a falling-part hazard safe.
Reference reading
Primary references for the underlying models, APIs or application context. The worked numbers and plots above are educational calculations, not results reported by these sources.