What you need
Use recorded digital input samples and a simulator. Know the controller sampling interval and the physical duration of a valid detection.
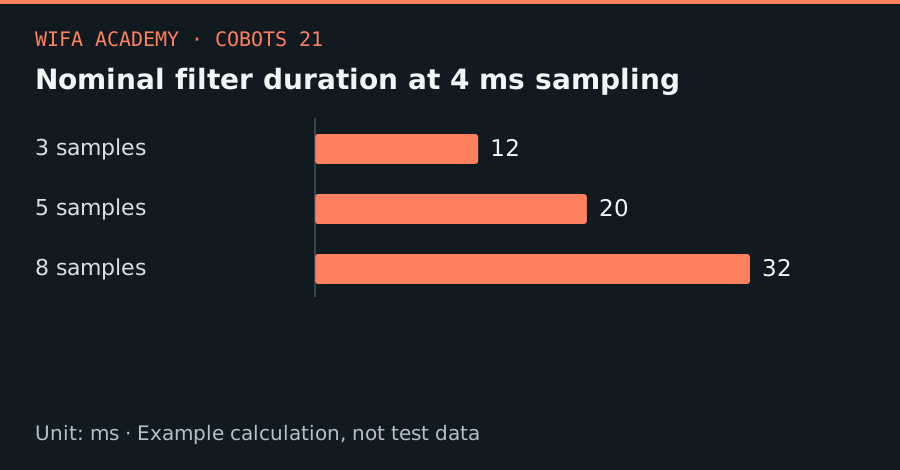
Read the diagram as a data table
| Condition or component | ms |
|---|---|
| 3 samples | 12 |
| 5 samples | 20 |
| 8 samples | 32 |
The calculation
t_filter ≈ N × T_sample
N is the required number of consecutive matching samples; T_sample is seconds. Phase relative to sampling adds up to roughly one sample of uncertainty.
Worked example
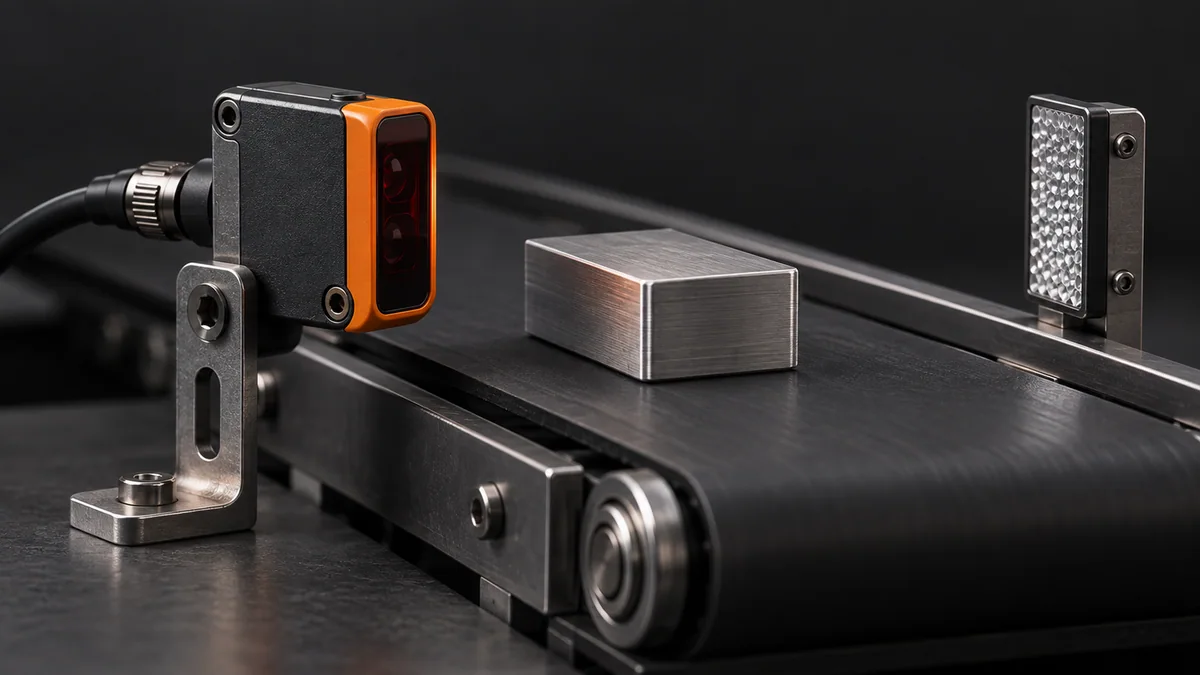
Five samples at a 4 ms interval give a nominal 20 ms filter. A 12 ms glitch should be rejected, but a genuine 16 ms pulse may also be lost. At 0.3 m/s conveyor speed, 20 ms corresponds to 6 mm of travel.
Try it step by step
- Capture the raw signal during several valid arrivals and nuisance transitions, keeping timestamps instead of looking only at the filtered bit.
- Choose a stable-time requirement shorter than the shortest legitimate presence interval and longer than the disturbances you intend to reject.
- Replay the signal through the filter and measure both false triggers and delayed or missed valid events.
- Document startup behavior, stuck-high detection and reset conditions; a sensor that never changes state may require a separate process fault.
How to check the result
Replay tests should demonstrate rejection of the selected glitches while preserving every valid event in the recorded test set.
Common mistake to avoid
Longer filtering is not automatically better. It can conceal short valid parts and increases location error on moving conveyors.
Reference reading
Primary references for the underlying models, APIs or application context. The worked numbers and plots above are educational calculations, not results reported by these sources.