What you need
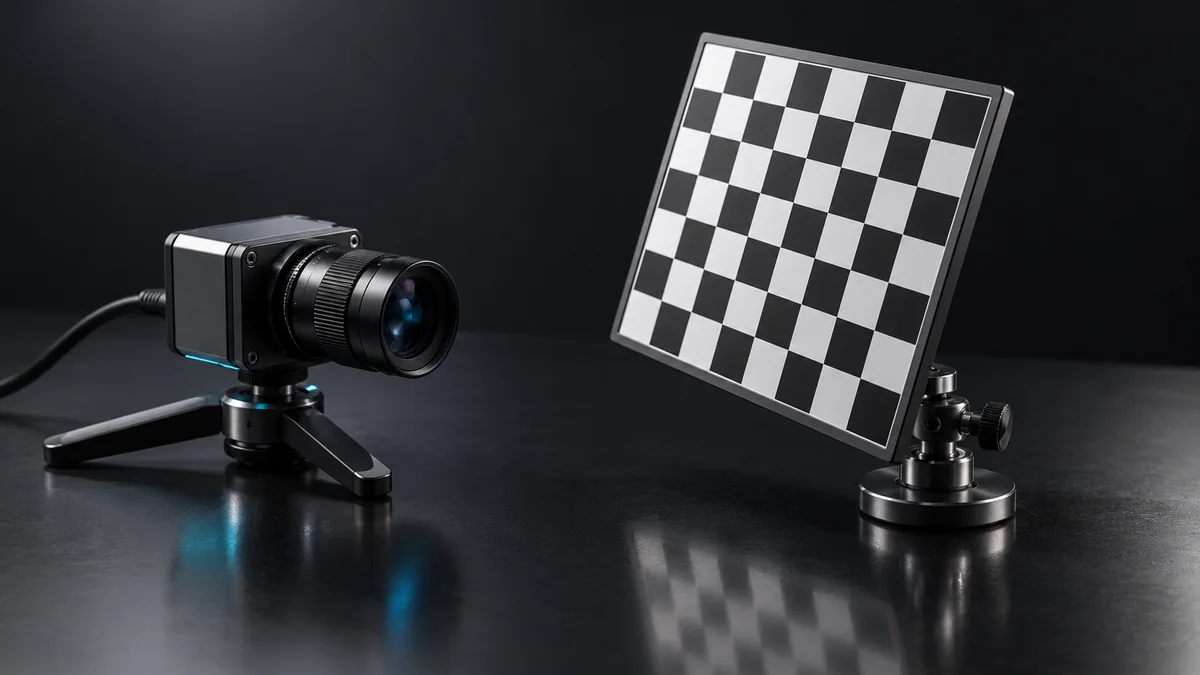
Use a rigid calibration board, fixed focus and a saved image folder. Record the true target dimensions and image resolution.
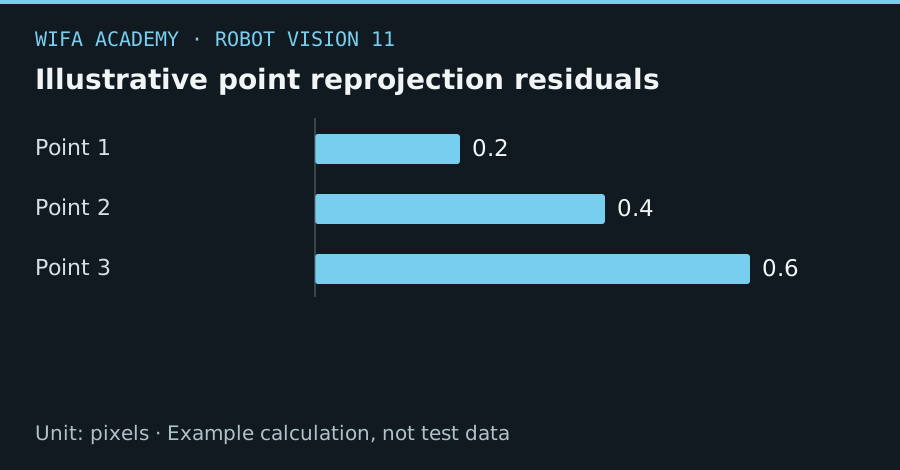
Read the diagram as a data table
| Condition or component | pixels |
|---|---|
| Point 1 | 0.2 |
| Point 2 | 0.4 |
| Point 3 | 0.6 |
The calculation
RMS = √[Σ||p_observed − p_projected||² / N]
N is the number of evaluated points. RMS is in pixels and measures reprojection consistency, not direct robot positioning accuracy.
Worked example
For illustrative residual magnitudes 0.2, 0.4 and 0.6 pixels, RMS is √[(0.04+0.16+0.36)/3] = 0.432 pixels. A low training residual alone can coexist with poor predictions near image corners.
Try it step by step
- Check target flatness and printed dimensions; a flexible or scaled print changes the geometry you are claiming to observe.
- Capture varied orientations and positions covering the image, avoiding motion blur, saturation and tiny target views.
- Fit camera intrinsics and a suitable distortion model, then inspect per-view errors rather than only the global score.
- Evaluate held-out images and save calibration together with camera identity, lens, focus, resolution and target dimensions.
How to check the result
Undistorted held-out target lines should behave plausibly across the frame, and independent physical measurements should meet the task’s tolerance.
Common mistake to avoid
Adding complex distortion parameters can overfit a weak image set. Changing focus or image scaling without updating calibration invalidates assumptions.
Reference reading
Primary references for the underlying models, APIs or application context. The worked numbers and plots above are educational calculations, not results reported by these sources.