What you need
Use a dimensioned sketch, measured calibration coupons and the relevant mating-part dimensions. Start with a non-load-bearing fit test.
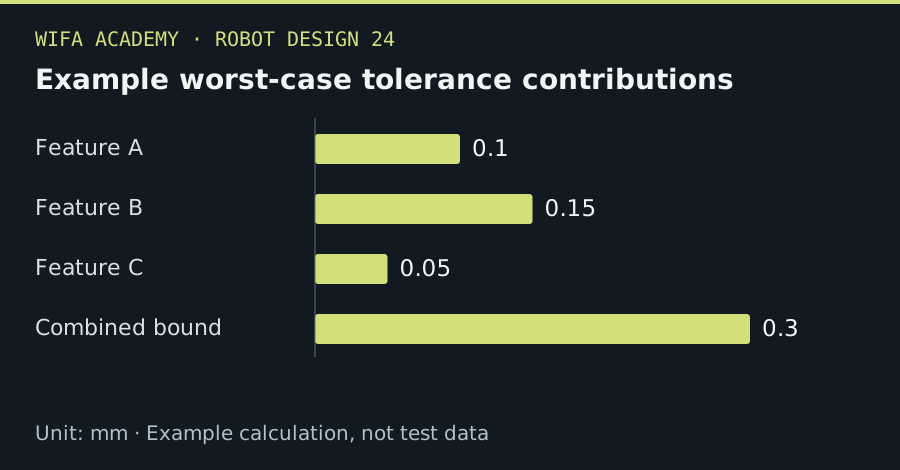
Read the diagram as a data table
| Condition or component | mm |
|---|---|
| Feature A | 0.1 |
| Feature B | 0.15 |
| Feature C | 0.05 |
| Combined bound | 0.3 |
The calculation
T_worst = Σ|T_i|
clearance = opening_size − inserted_size
T_i is a signed-dimension tolerance magnitude in mm. Worst-case stacking assumes each contributing limit may occur in the unfavorable direction.
Worked example
Three contributing dimensions with bounds ±0.10, ±0.15 and ±0.05 mm produce a worst-case stack of ±0.30 mm. A nominal 0.20 mm clearance could therefore disappear under an unfavorable combination.
Try it step by step
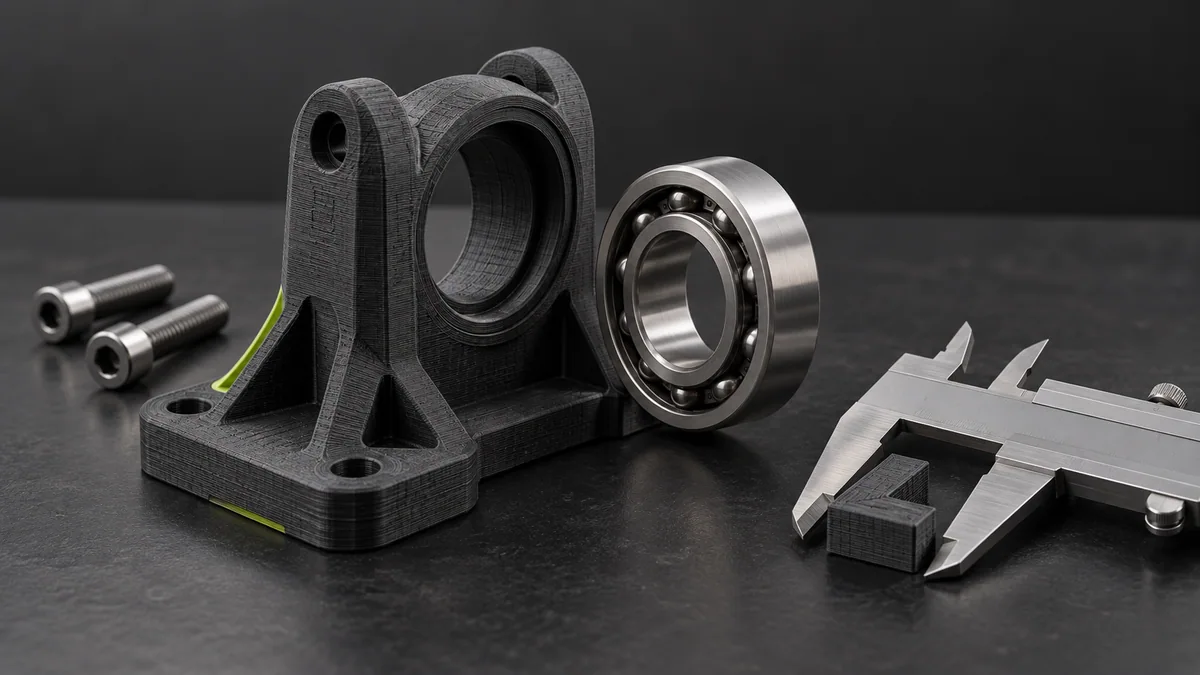
- Draw the dimension chain that directly controls the bearing, shaft or tool fit, excluding unrelated dimensions.
- Measure coupons printed with the intended material, orientation and settings rather than using a generic online offset.
- Choose tolerances and adjustable or machinable features according to function and the actual process capability.
- Assemble a fit prototype, inspect alignment and document revisions before using the design in a loaded moving mechanism.
How to check the result
Verify the smallest and largest expected mating conditions and record whether assembly requires damaging force or leaves excessive looseness.
Common mistake to avoid
Printed-part dimensions and stiffness can change with temperature, moisture, load and time. An initial successful fit does not establish long-term structural suitability.
Reference reading
Primary references for the underlying models, APIs or application context. The worked numbers and plots above are educational calculations, not results reported by these sources.