What you need
Use labeled image folders plus a table containing capture date, part instance, scene and camera configuration.
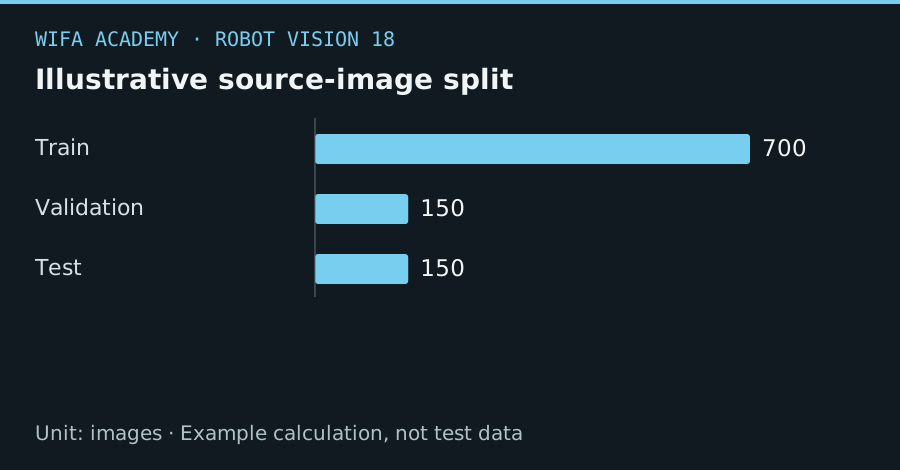
Read the diagram as a data table
| Condition or component | images |
|---|---|
| Train | 700 |
| Validation | 150 |
| Test | 150 |
The calculation
n_train + n_validation + n_test = n_total
Counts refer to original source images or grouped source units. Augmented variants belong to the same split as their source.
Worked example
For 1,000 original images, an illustrative 700/150/150 split gives 70%, 15% and 15%. A 30-frame burst should remain in one group; distributing its almost identical images across all three sets can inflate reported performance.
Try it step by step
- Create group identifiers for sessions or physical instances and inspect duplicates before assigning any split.
- Assign groups while preserving necessary class coverage, and keep the test set untouched during threshold and model selection.
- Apply augmentation only after splitting and keep source lineage so related images cannot cross evaluation boundaries.
- Document missing operating conditions, then deliberately capture them rather than relying on synthetic variation to replace real evidence.
How to check the result
Inspect nearest-looking image pairs across splits and evaluate by operating condition, not only by overall class totals.
Common mistake to avoid
The example ratio is not a universal prescription. Very small datasets may need grouped cross-validation, but a final independent evaluation remains valuable.
Reference reading
Primary references for the underlying models, APIs or application context. The worked numbers and plots above are educational calculations, not results reported by these sources.